


- Business Process Management (BPM)Document Management System (DMS)Electronic Quality Management System (QMS)Risk, Governance & Compliance (GRC)Low Code Rapid Application Development (LC)Business Continuity Management (BCM)Enterprise Architecture (EA)Business Process Management (BPM)
 Document Management System (DMS)
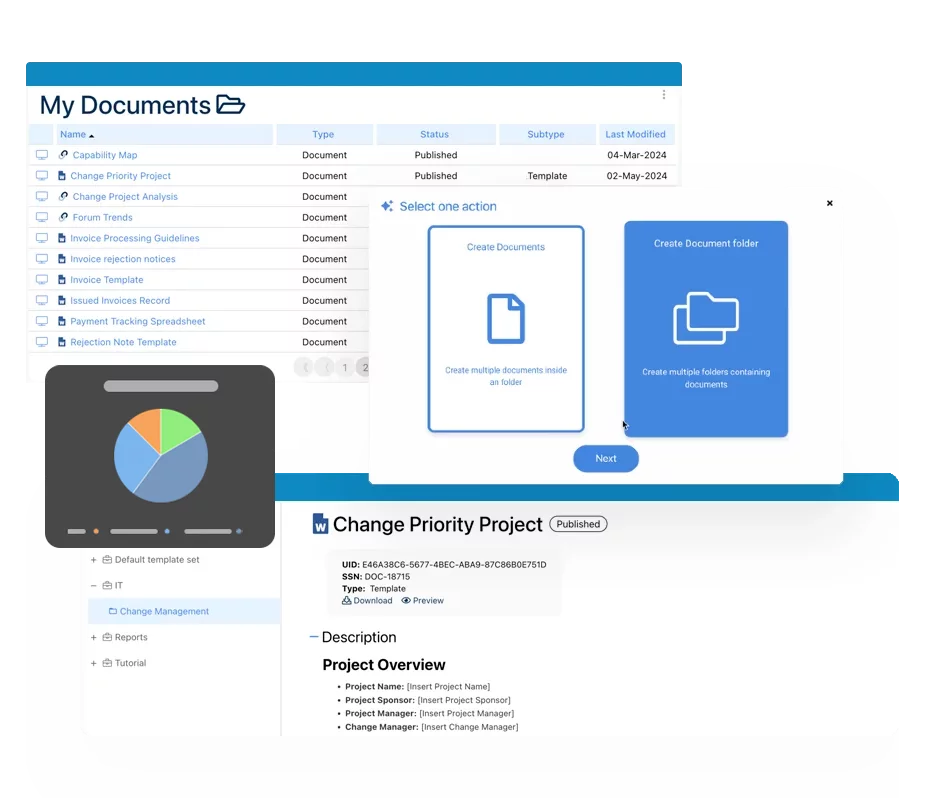 Electronic Quality Management System (QMS)
 Risk, Governance & Compliance (GRC)
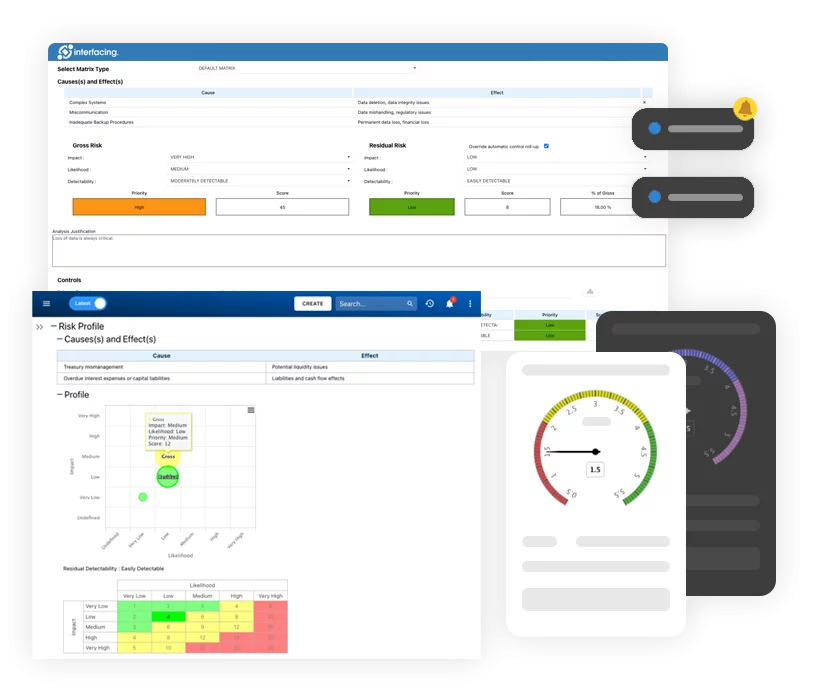 Low Code Rapid Application Development (LC)
 Business Continuity Management (BCM)
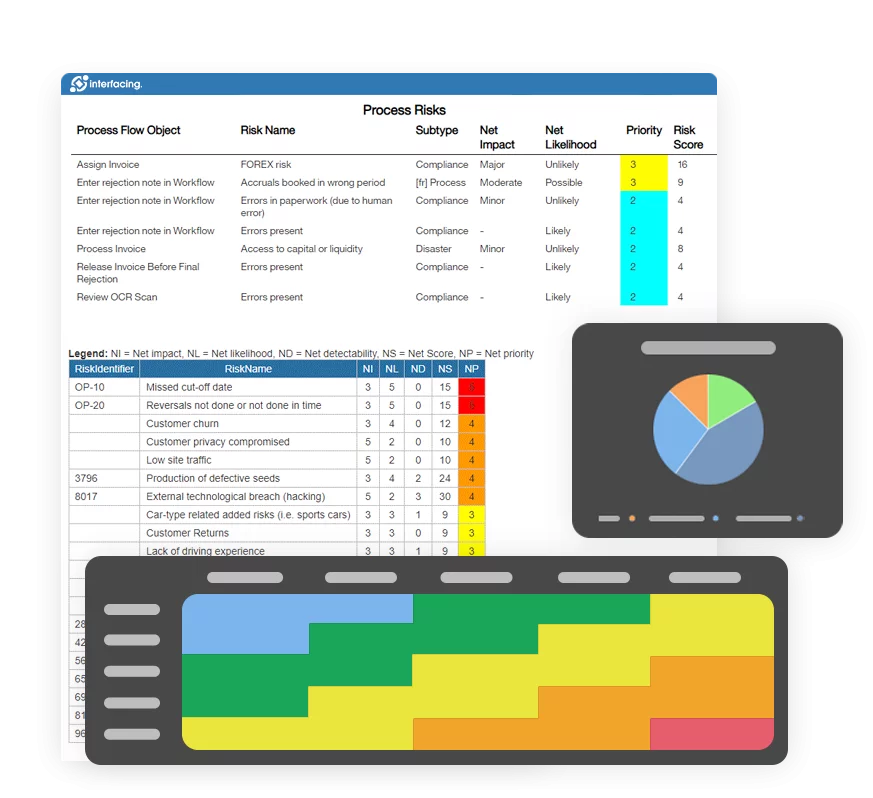 Enterprise Architecture (EA)
- IndustriesRegulatory ComplianceUse CasesLearning CenterFramework & PracticesIndustriesRegulatory Compliance
 Use CasesLearning CenterFramework & Practices
 - AboutCustomer SuccessPartnersAbout
 Customer SuccessPartners


Business Process Simulation
Please Select contact form.
Business Process Simulation BPS provides the knowledge and flexibility to evolve your current processes efficiently, preserving resources and reducing costs.

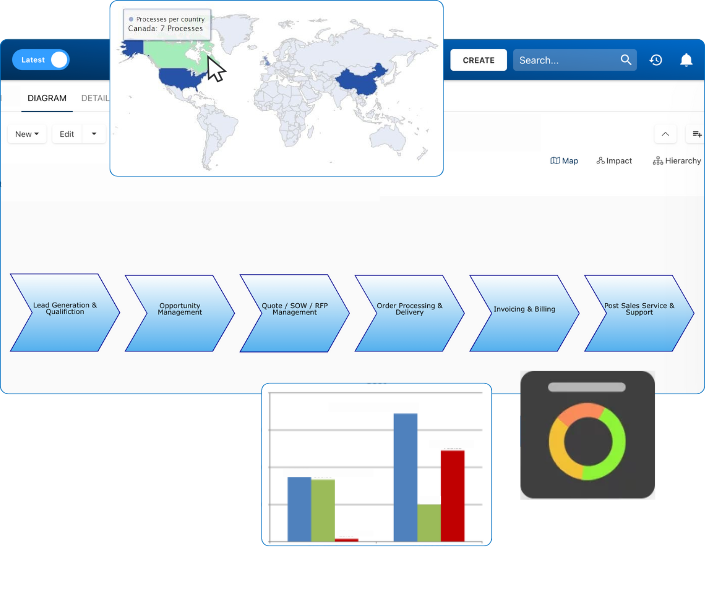
EPC delivers high performance business process simulations. It only takes a few seconds, using thousands of process instances to conduct a simulation. The simulation will provide you with the Key Performance Indicators (KPIs) of any scenario using a business process as well as the activity-based statistics related to each individual process. As an example, visualizing bottlenecks in a particular process can be achieved by creating a heat map.
It’s important to note that you will need a BPMN 2.0 notation business process model and a simulation scenario prior to conducting a simulation. For example:
- Providing the number of process instances to simulate
- Determine the arrival date
- Determine the resources needed and how many are available
- Determine the duration of the tasks, events, and sub-processes, etc.


Results of the Simulation
Once the simulation is complete, the Simulator produces data providing insights on the performance of the business process model in the specific scenario. At this point, you will receive KPIs (key performance indicators) of the scenario, individual task, resource utilization, process event logs and sub-process KPIs. A more detailed description can be found below.


BPMN Element Task Statistics
Each element, sub-process and task in the BPMN model will have statistics calculated for each. The Simulator tool provides the count, min/max, waiting time, cycle time and average element cost. For example if you provide in your scenario, a duration threshold or cost for an element, then the min/max and averages are calculated.

Parameters of a Simulation
As a general rule, you will need a business process model in BPMN 2.0 and scenario simulation information prior to conducting a simulation. Along with the BPMN model, you will also be tasked with providing the number of process instances you want to simulate and the arrival rate (how frequently you want to start them), the resources you need and how many of them are available, the expected duration of the task and more parameters if needed. If the business process you are simulating has been implemented already, mining the existing process logs will get you all the data you need. From this, you may come up with hypothetical stress tests for example. The information below will help to explain the data needed in order to define a simulation.

BPMN 2.0 supporting information
The thing Business Process Modeling Notation brings is standardization and the ability to show who is doing what and when, plus the ability to make process flow paths easier to read by moving the details of a process into a more detailed level. Instead of having process taken up on a wall, you can create BPMN Process Models where you fit the primary business logic on a single page and then drill down to the next level if you want or need to see the details.
There is a universal symbology to the language that bridges the gap between those in technical development, business analysts and all the way up to the C-Suites execs who can all understand the various sequence of events, activity and information that flows along an array of automated tasks.
BPMN 2.0 uses four main elements in a diagram, they are:
- Flow objects
- Connecting objects
- Swimlanes
- Data


Activities
These symbols indicate a specific task to be performed by a system or person. Process designers can create many such activities ranging from those that occur once to those that occur multiple times or when a specific set of conditions are met.
- Task – This is the most common symbol used. It describes the precise action required in order to complete the task.
- Sub-process – Within this task, are additional sub-tasks categorized together.
- Transaction – This commonly refers to the function of payment processing but is much, much more. Transactions are best described as a set of activities that would need to be underdone if an error is detected in the process. In IT terminology it is known as a “roll-back”, i.e. you need to roll-back all the actions taken in the transaction to leave the information at the same state as when the Transaction process was started.
- Call – A Call Activity refers to Tasks and Sub-Processes that can be used in multiple or different areas of a process.

Events
This symbol serves as a trigger. It can initiate a starting point, an intermediate step, or act as the end-point of a specific process. Commonly used events can be:
- Timer – This symbol can identify the start of a timer. For example, a free trial is offered for 30 days in which a customer has the option to cancel anytime within this window. It may also be used on a certain weekday, for instance, every Tuesday, a list is compiled indicating who has cancelled the trial or who are the new free trial registrants.
- Link – Indicates a process belonging to a bigger ecosystem and links off into the direction of different tasks that comprise a new but separate set.
- Message – As it is described, messages are being passed via some technology interface, like EDI (Electronic Data or Document Interchange).
- Escalation – in order to facilitate a specific action, a higher-up authority will need to make a decision on the task. For example, an application for insurance coverage that is borderline must be escalated to the senior manager for manual review.
- Error – An interruption to the workflow has occurred, due to an issue.

Gateways
These diamond shaped symbols are used to map decision points along the workflow. They can indicate for example, forks in the road that require a decision in order to determine the next direction a process will need to take. Some examples:
- Exclusive – An example of an exclusive gateway could be when you approach a door that requires an entry code. The correct code allows entry while an incorrect code causes a different outcome.
- Inclusive – Inclusive gateways, allow processes to go down more than one path, as opposed to Exclusive gateways
- Event-based – This is the fork in the road scenario we mentioned above. A decision must be made to move ahead. Let’s say every Tuesday a list was generated of new users during the previous week. If on a particular week no new users signed up then no list would be generated on the following Tuesday.
- Parallel – These gateways can run concurrently and are not dependent on a certain condition.


Documentation: Driving Transformation, Governance and Control
• Gain real-time, comprehensive insights into your operations.
• Improve governance, efficiency, and compliance.
• Ensure seamless alignment with regulatory standards.

eQMS: Automating Quality & Compliance Workflows & Reporting
• Simplify quality management with automated workflows and monitoring.
• Streamline CAPA, supplier audits, training and related workflows.
• Turn documentation into actionable insights for Quality 4.0

Low-Code Rapid Application Development: Accelerating Digital Transformation
• Build custom, scalable applications swiftly
• Reducing development time and cost
• Adapt faster and stay agile in the face of
evolving customer and business needs.
AI to Transform your Business!
The AI-powered tools are designed to streamline operations, enhance compliance, and drive sustainable growth. Check out how AI can:
• Respond to employee inquiries
• Transform videos into processes
• Assess regulatory impact & process improvements
• Generate forms, processes, risks, regulations, KPIs & more
• Parse regulatory standards into requirements
